Crowdsec is a relatively new tool in the security world, it’s an Intrusion Prevention Systems (IPS), it allow the detection of threats and the adding of necessary firewall rules if needed.
Crowdsec differs from other IPS because of the collaboration aspect. It also offer an on-premise or cloud dashboard.
You may have heard, or used Fail2ban, it basically do the same things, but with more functionalities.
Pros
Open-Source
Collaborative security
Decoupled detection and action software
Ease of use
IPv6 Ready
GDPR Compliant
Easy to install & setup
Large support for many services
Cons
Not easily understandable
Can be hard to setup depending on your setup
Type of recognized threats
Threats recognized by Crowdsec
How does it works ?
First it gather the logs and parse them from any source, it also applies scenarios to identify cyber-threats, then rules are set depending of the desired behavior.
Crowdsec has two main components, the scenarios and the bouncers. The scenarios detect the type of threat and the bouncers make an action to ban/correct it. You can also choose to only use one of the two parts.
Bouncers are used to “apply” decisions, from threats detected by the Crowdsec software.
Before installing the basic bouncer that will act on your firewall rules, you need to check if your system is using iptable or nftableto determine where your system should act to prevent the attacks.
Then, you can use the basic firewall bouncer. It will check for the most common cases of attacks on your server (Brute-force, Slow brute-force, …).
apt install crowdsec-firewall-bouncer-iptables
Install the Linux firewall bouncer
Then, depending of the service(s) you are running on your server, you can use one more other bouncers.
An other step towards internet privacy & security.
Quick recap about DNS and encrypted internet traffic.
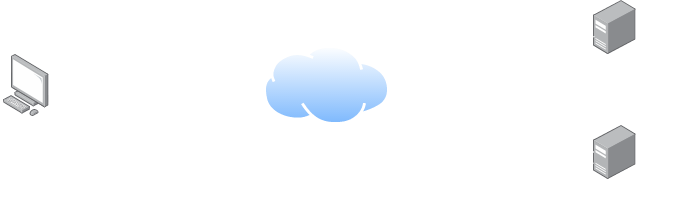
Domain Name Service (DNS) acts like a phone book, but instead of linking a phone number to a person, it links an IP address to a domain name. It’s like a huge registry remembering entries for IP/domain name association.
When a computer wants to reach out a domain, let’s say google.com, it ask the DNS server for an IP to reach. because computers communicates with IP adresses to find the path to access it, this service is one of the most important on the internet. The DNS server then “resolve” the domain name to an IP and send back the answer to the computer who asked for it.
DNS Protocol
But why are we talking about that old protocol ?
By default, DNS queries and responses are sent in plain text (via UDP), which means they can be read by networks, ISPs, or anybody able to monitor transmissions. Even if a website uses HTTPS, the DNS query required to navigate to that website is exposed.
This lack of privacy has a huge impact on security and, in some cases, human rights; if DNS queries are not private, then it becomes easier for governments to censor the Internet and for attackers to stalk users’ online behavior.
DNS over TLS protected traffic. Source : Cloudflare
More and more public DNS providers start to support encrypted DNS requests, this prevents third parties to access or modify the DNS queries made between your terminal and the DNS server.
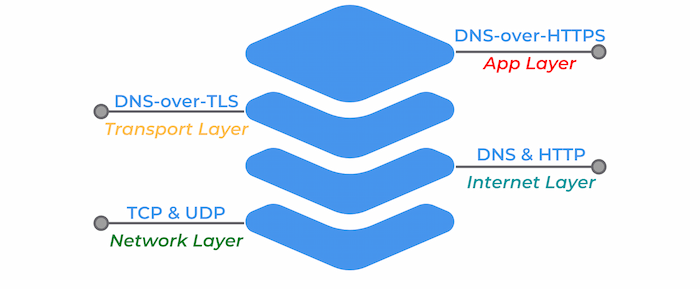
DoH is DNS over HTTPS, an encrypted DNS making use of port 443, which mean that it appears just like regular HTTPS traffic. This kind of requests are more interesting from a privacy standpoint, because they cannot be differentiated from other day to day HTTPS traffic. This is certainly the best solutions for individuals.
Note : If you are using a firewall or other networking equipment keep in mind that the DNS traffic in not even recognizable and cannot be treated as such, no rules or traffic routing can be applied to this particular DNS traffic because it looks just like regular HTTPS.
DoT on the other hand is DNS over TLS, an encrypted DNS using port 853. It’s still a DNS request, but wrapped in TLS, in a lower layer level encryption. It also ensure that requests are not tampered during the communication with the DNS server.
Source : dnsfilter.com
PfSense Firewall configuration for DoT
Prerequisites
First, you need to choose your DNS resolver. If it’s not already done make sure that it support encrypted DNS queries. Feel free to check the privacy project website to find one.
List of public DNS | Encryption support indicated
Make sure your pfSense version is greater than 2.4.4. If not, you can find the old tutorial on the Netgate website below.
Setup for pfSense 2.4.4 and before
Step 1
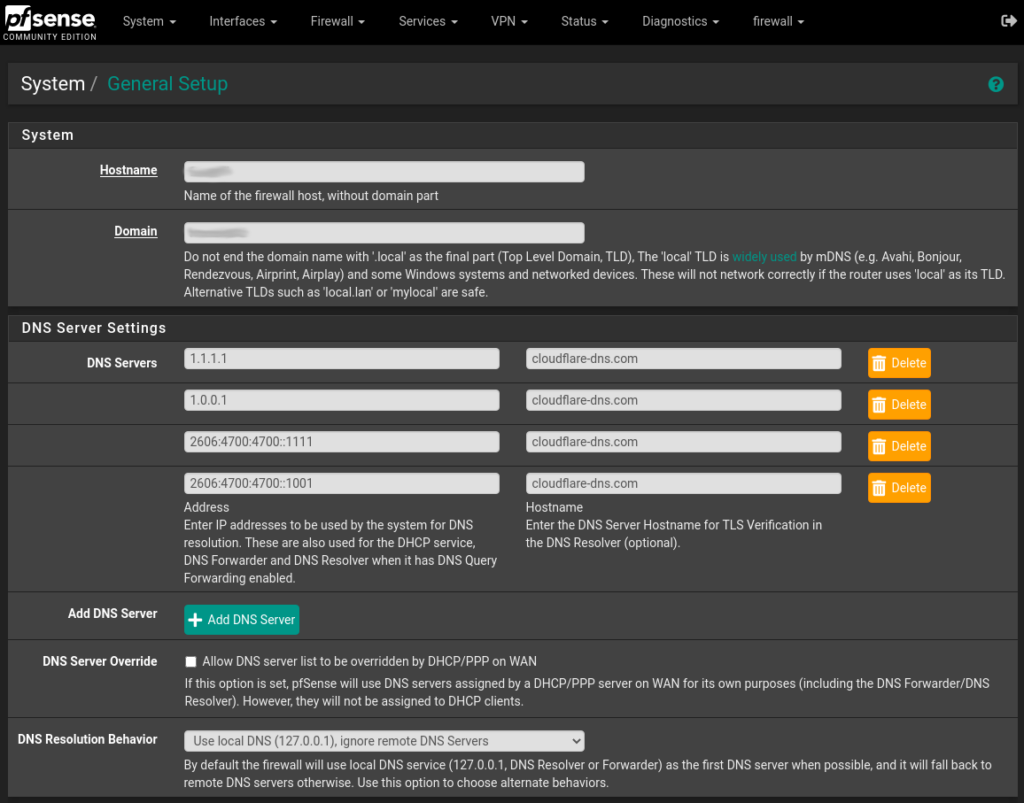
The first step is to ensure that your selected DNS provider servers are in use, even if the DNS queries are not sent over TLS for now (step 2). To set this up, navigate to System > General Settings and under DNS servers add the IP addresses & hostnames for your encrypted DNS provider. Also use the Use local DNS, ignore DNS Servers option in the drop down menu.
Pfsense DNS Settings
After entering the informations, scroll down to the bottom of the page and click Save. Your pfSense server will now use your selected DNS providers for it’s own DNS requests.
Feel free to mix and match the servers, you can add as many as you like, and using multiple DNS providers can help prevent an upstream outage from causing loss of DNS resolution on the firewall.
Step 2
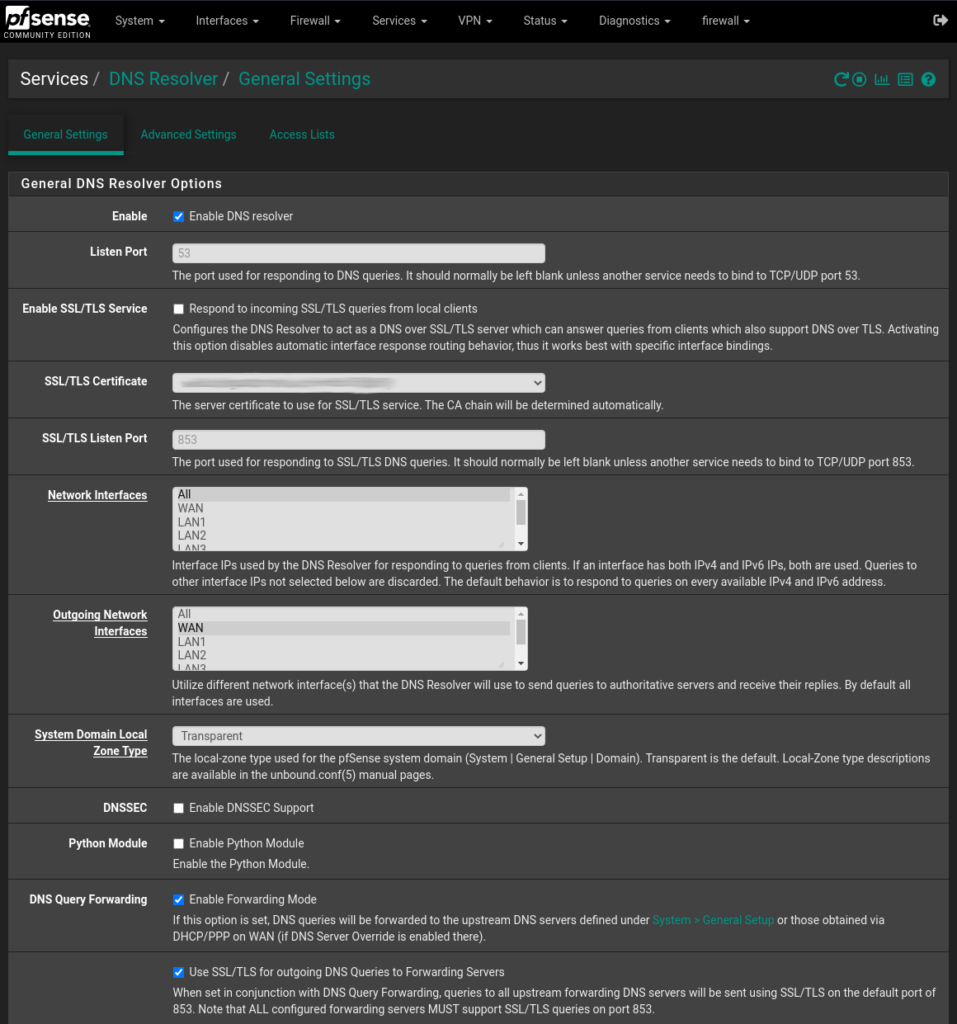
To configure the DNS resolver to send DNS queries over TLS, you first need to enable it. Navigate to Services > DNS Resolver and on the tab General Settings check the Enable DNS resolver checkbox, also select ALL for Network Interfaces and your WAN interface for Outgoing Network Interfaces.
Note: This guide applies only to DNS resolver. Forwarding mode must be disabled in the DNS resolver settings, since the example below defines its own forwarding zone.
Next let’s enable the TLS capabilities, let’s check the Enable Forwarding Mode and the Use SSL/TLS for outgoing DNS Queries to Forwarding Servers checkbox.
DNS_Settings
Click Save and you’re good to go ! Your pfSense appliance is now sending DNS queries to your provider DNS servers over TLS.
Check your setup
To check if your setup is working properly, you can perform various tests using Cloudflare DNS & browser checks.
Cloudflare Browser Check1.1.1.1 DNS Check (Only works with Cloudflare)
You can also confirm if DNS queries are being sent over TLS by performing a packet capture on the WAN interface. To do that go to Diagnostics > pfTop. In the Filter expression field enter the following :
port 53 or port 853
Now only DNS traffic is showed, note that unencrypted DNS is still allowed and can go through, the best way to mitigate this problem is to deny outbound traffic on port 53 if wanted.
Tor, short for The Onion Router, is free and open-source software for enabling anonymous communication. It directs Internet traffic through a free, worldwide, volunteer overlay network, consisting of more than six thousand relays, for concealing a user’s location and usage from anyone conducting network surveillance or traffic analysis. Using Tor makes it more difficult to trace the Internet activity to the user. Tor’s intended use is to protect the personal privacy of its users, as well as their freedom and ability to conduct confidential communication by keeping their Internet activities unmonitored.
Questions you should clarify before configuring a Tor service
Do you want to run a Tor exit or non-exit (bridge/guard/middle) relay?
If you want to run an exit relay: Which ports do you want to allow in your exit policy? (More ports usually means potentially more abuse complaints.)
What external TCP port do you want to use for incoming Tor connections? (“ORPort” configuration: We recommend port 443 if that is not used by another daemon on your server already. ORPort 443 is recommended because it is often one of the few open ports on public WIFI networks. Port 9001 is another commonly used ORPort.)
What email address will you use in the ContactInfo field of your relay(s)? This information will be made public.
How much bandwidth/monthly traffic do you want to allow for Tor traffic?
Bridge relays are Tor relays that are not listed in the public Tor directory.
That means that ISPs or governments trying to block access to the Tor network can’t simply block all bridges. Bridges are useful for Tor users under oppressive regimes, and for people who want an extra layer of security because they’re worried somebody will recognize that they are contacting a public Tor relay IP address.
A bridge is just a normal relay with a slightly different configuration. See How do I run a bridge for instructions.
Several countries, including China and Iran, have found ways to detect and block connections to Tor bridges. Obfsproxy bridges address this by adding another layer of obfuscation. Setting up an obfsproxy bridge requires an additional software package and additional configurations. See our page on pluggable transports for more info.
Docker use OS-level virtualization to deliver software in packages called containers, using that technology is more secure if you are planning to host other services on the same host as well.
In this case we are using “docker-compose” for convenience, with one file we can deploy the full Tor-bridge with minimal effort and the same efficiency as in plain docker.
How to host a bridge using docker-compose
To host a Tor bridge container, your first need to have a docker & docker-compose installed. Then make sure you select two public ports and forward them to your Tor bridge server if you are using NAT based network environment.
Create two following files in the same directory. Make sure to change your environment variable in the .env file to match your current setup.
Make sure to uncomment variables to use them properly, make also sure to not edit the docker-compose volumes structure, or if you want to do so, check the link below.
docker-compose.yml
version: "3.4"
services:
  obfs4-bridge:
    container_name: obfs4-bridge
    image: thetorproject/obfs4-bridge:latest
    environment:
    # Exit with an error message if OR_PORT is unset or empty.
      - OR_PORT=${OR_PORT:?Env var OR_PORT is not set.}
    # Exit with an error message if PT_PORT is unset or empty.
      - PT_PORT=${PT_PORT:?Env var PT_PORT is not set.}
    # Exit with an error message if EMAIL is unset or empty.
      - EMAIL=${EMAIL:?Env var EMAIL is not set.}
    env_file:
      - .env
    volumes:
      - data:/var/lib/tor
    ports:
      - ${OR_PORT}:${OR_PORT}
      - ${PT_PORT}:${PT_PORT}
    restart: unless-stopped
    volumes:
      data:
    name:
      tor-datadir-${OR_PORT}-${PT_PORT}
.env
# This file assists operators in (re-)deploying an obfs4 bridge Docker container.  You need the tool 'docker-compose' to use this file. You can find it in the Debian package 'docker-compose'.
First, you need to create a configuration file, ".env", in the same directory as this file, "docker-compose.yml".  Add the following environment variables to this configuration file.  EMAIL is your email address; OR_PORT is your onion routing port; and PT_PORT is your obfs4 port:
EMAIL=you@example.com
OR_PORT=XXX
PT_PORT=XXX
## If needed, you can also activate there an additional variables processing with:
##   OBFS4_ENABLE_ADDITIONAL_VARIABLES=1
## followed by defining desired torrc entries prefixed with OBFS4V_
# For example:
##   OBFS4V_AddressDisableIPv6=1
The first thing you can do is check your logs for an error, if you see none and you see the bandwidth speedtest complete, you can check for your relay on the Tor metrics website.
docker logs obfs4-bridge
To identify your relay you need your tor bridge hashed identity key, you can find it in the logs, it should look like this.
Your Tor bridge's hashed identity key fingerprint is 'DockerObfs4Bridge AAAABBBBCCCCDDDDEEEE'
If you are here, you may had problems to manage your fans speed or check your temps on Linux.
Fortunately there are some tools to help you with that, one of the most known is lm-sensors, it provide a tool for GNU/Linux systems to monitor and handle temperatures, tensions, fan speed & moisture levels.
The current supported sensors are :
ISA hardware monitoring chips.
I2C/SMBus hardware monitoring chips.
SPI hardware monitoring chips.
Hardware monitoring features integrated in Super-I/O chips.
Hardware monitoring features integrated in south bridges.
Thermal sensors integrated in CPU.
Thermal sensors integrated in memory modules.
Installation & detection
Proceed to the installation of “lm-sensors”.
sudo apt install lm-sensors
Then you can run the sensor detection tool.
sudo sensors-detect
The output should look like this, it can vary depending of your hardware.
sensors-detect version 3.6.0# System: ***# Board: ***# Kernel: ***# Processor: ***This program will help you determine which kernel modules you needto load to use lm_sensors most effectively. It is generally safeand recommended to accept the default answers to all questions,unless you know what you're doing.Some south bridges, CPUs or memory controllers contain embedded sensors.Do you want to scan for them? This is totally safe. (YES/no): Module cpuid loaded successfully.Silicon Integrated Systems SIS5595... NoVIA VT82C686 Integrated Sensors... NoVIA VT8231 Integrated Sensors... NoAMD K8 thermal sensors... NoAMD Family 10h thermal sensors... NoAMD Family 11h thermal sensors... NoAMD Family 12h and 14h thermal sensors... NoAMD Family 15h thermal sensors... NoAMD Family 16h thermal sensors... NoAMD Family 17h thermal sensors... Success! (driver `k10temp')AMD Family 15h power sensors... NoAMD Family 16h power sensors... NoHygon Family 18h thermal sensors... NoIntel digital thermal sensor... NoIntel AMB FB-DIMM thermal sensor... NoIntel 5500/5520/X58 thermal sensor... NoVIA C7 thermal sensor... NoVIA Nano thermal sensor... No
Here the lm-sensors software is trying to guess what kind of CPU you have to find which sensors are present, some prompts will then appears, just go for the recommended values and reboot.
If you have a graphics card, your GPU sensors should also be recognized.
To check every detected sensors, just type the following command.
sensors
If you are running on a laptop, this install can provide more information to your fan controllers and in some case, resolve fan speed & temperatures issues.
GUI for Temperature & Fan speed visualisation
You can use psensor to get a quick visualisation of your temps and fan speed after executing the lm-sensors tool
In Windows, when you want to transfer files from a place to another you usually use the standard Copy/Paste/Move process, but it comes with a downside, it only use one thread on your system which is insane on an recent operating system, now mainly used on multi-threaded systems.
Depending on your system, the read/write performance of your disk can be the main bottleneck for file transfer speed, but if you are using a fast SSD/HDD, the number of used cores can be the bottleneck of your file transfer speed.
To prevent this, you can use a Microsoft command line utility called “Robocopy” for “Robust File Copy” with a special option for Multi-Threading.
This tool is available since Windows Server 2012 and on Windows 10 and above.
/ZB — Uses restartable mode. If access is denied, use backup mode.
/TBD — Wait for share names To Be Defined (retry error 67).
/NP — No Progress – don’t display percentage copied.
/V — Produce verbose output, showing skipped files.
/compress — Ask for network compression during transfer, if needed.
/MT:n — Do multi-threaded copies with n threads (default is 8).
The default number of used threads with the MT option will be 8, Robocopy will try to copy eight files simultaneously by default. However, Robocopy supports from 1 to 128 threads.
Note that depending on your setup, you may not notice improvements on your copy process. But it’s usually way more efficient when moving a large amount of files.
You may have encountered the following warning after a Nextcloud install or you may even never seen it but Nextcloud need to execute some background tasks regularly to insure it’s good working condition. Some cleanups need to be executed on a daily basis.
If you don’t know what I’m talking about, check your Nextcloud application settings : Open your Nextcloud instance with a privileged account > click on your icon > Settings > Basic settings.
There is 3 different ways of executing these scheduled tasks :
AJAX
Webcron
Cron
The AJAX is the default one but it’s the less reliable because this technique only execute one task per page reloaded by an user, it requires many visits to be efficient.
The Webcron can be an good choice depending on your setup, but it rely on an external source to execute your Cron. You can use a service like easyCron to load your http[s]://<domain-of-your-server>/nextcloud/cron.php URL, that will trigger the execution of the jobs.
The Cron method is, to me, the most reliable, you just have to enter how often you want your background tasks to run. As long your server is running, the task will execute, it’s that simple.
Setup
Two ways are gonna be covered, the classic way or the Docker way, depending of your install type.
Classic installation :
You just have to set a Cron task, it’s that easy ! To check your active Cron jobs just execute the following command in a terminal.
crontab -l
This will list (-l) your active Cron tasks.
To edit (-e) you Cron file you will need to edit it as the user www-data (The nextcloud user).
crontab -e -u www-data
Here you can insert a new line at the end of the document with the following.
*/5 * * * * php -f /var/www/nextcloud/cron.php
This will trigger the Cronjob execution every 5 Minutes (Time used in the Nextcloud Doc)
On some systems it might be required to call php-cli instead of php.
If you want to force the execution of Cronjobs, you can enter the command manually :
In Docker the idea is pretty munch the same, but the process must be executed in the host system instead of the container itself. By editing the host Crontab file you can specify the container and the user you want to use.
First we need to identify the Nextcloud container name.
docker ps
With this command, you can list every running containers. Find the name of your nextcloud one and get to the next step. In our case the container will be named “Nextcloud“.
Next, we are gonna try the command manually and check if it’s triggered in the container. In the host terminal type :
docker exec -u www-data nextcloud php cron.php
If the background jobs tab now show a green dot after a page refresh, the command is working, we just need to make it run every 5 Minutes.
Successful Background Jobs Execution
On your Docker host system, edit the Cron file by typing :
crontab -e
Add the following line at the end to execute it every five minutes :
Some OS, have non persistant Cron settings after reboot (e.g Unraid), to counter that we can edit the starting script of the OS to insert the Nextcloud Cronjob line after startup.
In Unraid, the startup script is located under /boot/config/go, by editing this file, we can execute actions after the initial startup.
nano /boot/config/go
In the “go” file add the following script at the end :
In this article we are gonna setup a WSUS server to manage & accelerate the update process of Windows based computers.
What is a WSUS Server ?
WSUS stand for “Windows Server Update Services”, it allows the centralization of Windows updates for an organization by downloading every selected updates from Microsoft on a local server, to allow a better distribution on local Windows clients when needed. It acts like a “Cache” service for Windows updates.
WSUS Process / Cloudkid
How does the WSUS service works ?
First the service needs to fetch the selected updates from Microsoft servers on a local storage support. Then the service makes itself available as a web server on ports 8530 HTTP & 8531 HTTPS to distribute the updates to Windows clients.
This service will also permit the selection of targeted clients in different groups to allow a munch better control of updates for the endpoints. The same goes for downloaded updates, it’s possible to choose which updates want to be downloaded or not for bandwidth and storage concerns. Some specifics updates & languages packs could be specified.
Setup
Prerequisites :
Windows Server 2012 or greater
Solid Internet Speed
At least 250 Gb recommended
Now, let’s take the dive in the installation & the setup of the service.
I. Service installation
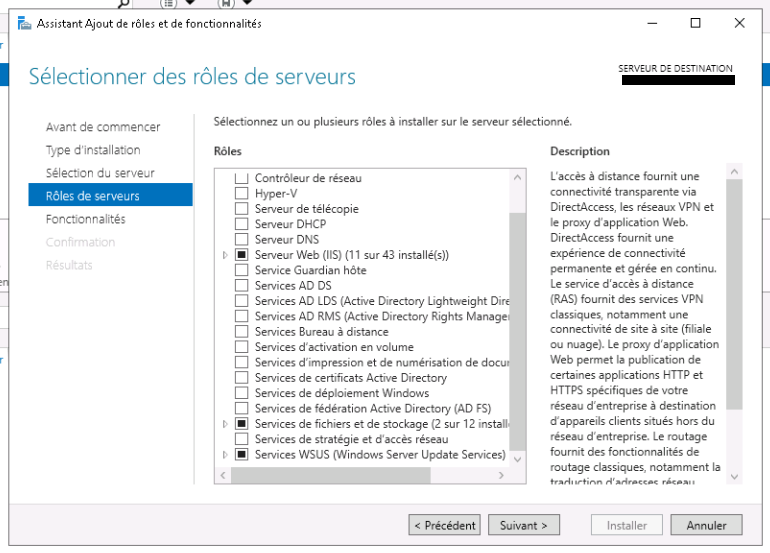
First things first, let’s install the service, on your Windows server, launch your Server Manager and go to : Add roles and functionalities > Install based on a role or functionality and tick the “WSUS Services” box. By ticking this case other needed components will be automatically installed too, our web server service (IIS) to distribute updates for instance.
WSUS Service installation / Cloudkid
When the installation ends, a restart could be necessary. A prompt for post installation will then show up as a notification, click on it and follow the instructions. See the informations below to insure that you do not miss any details.
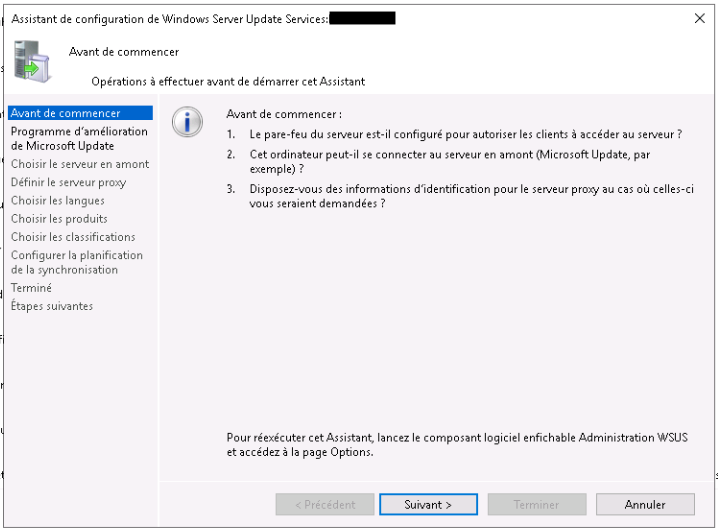
II. Service configuration
Service-Setup
Before starting : In this section, some sanity checks are asked to insure the good working condition of your service. Read the prompts carefully and adapt your topology.
Improvement program : Basically telemetry, if you want information about your installs to be sent to Microsoft to improves their services, I recommend turning this off.
Choose a download server : Here we can define the location from where we want to fetch our updates, an other WSUS server for instance or directly from Microsoft. For our first install, we will choose “From the internet” (Default).
Proxy Server : If our organization use a proxy server and our WSUS server should get is traffic routed by this proxy, we need to specify that here.
Choose the options :
Here, we can choose what do we want to keep in cache for the updates, for that there is 3 main categories.
Languages
Products
Classifications
Select the categories carefully, each one can use a lot of storage and/or bandwidth for the initial download.
When you are done with the assistant, a first big Sync will start, if it’s not the case double check your settings or enable it manually. The server will sync is local storage with the remote Microsoft database.
III. Update management
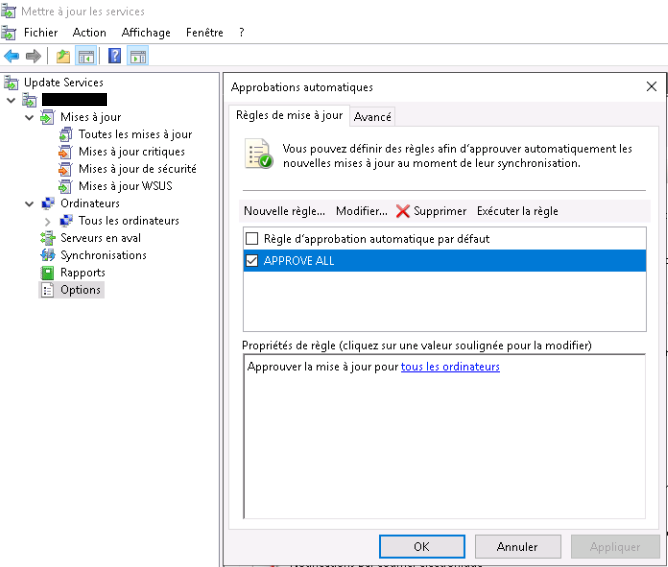
The updates have to be manually approved by the administrator to be deployed on clients endpoints but it is also possible to define auto approval rules depending on several parameters.
To define a rule to auto approve every update we will head to the side menu Options > Automatic approbations > New rule we could the set the following rule :
Approve updates for every computer
Setup
Creating groups can also permit a munch granular selection for updates. You can then deploy updates on a per group basis.
IIV. Client configuration
The service is now accessible from the network, to check that, we can go to the web page from which clients computers are gonna download updates from our WSUS. Open your browser and type ServerIP:8530 or ServerIP:8531 depending of your config.
If you get a white blank page as an answer, then your service is accessible, if you receive an HTTP Error code, double check your setting or re-run the WSUS configuration assistant.
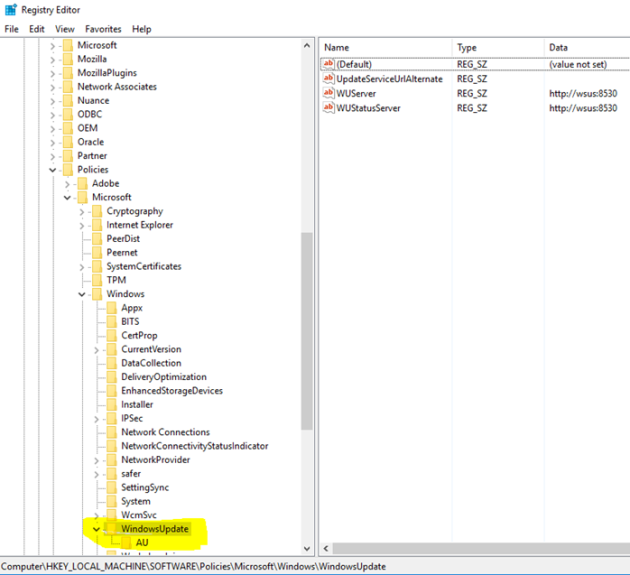
To add clients, we need to specify them where to look for new updates. To achieve that we need to edit some values in the registry. Here we can define some parameters like the frequency of update checking, the WSUS server location (IP & Port or DNS Name) and more.
Registry keys location & value / Nideesh Solutions
Refer to the picture for client configuration
The client configuration can be really hard to configure for a huge amount of clients, for that kind of setup a GPO (Group Policy Object) is strongly advised for large-scale deployment.
IV. Client configuration (GPO)
To deploy our setup in an organization at large scale, we are gonna use a GPO. To test it, let’s create an OU (Organizational unit) first, i’m gonna call mine “WSUS”.
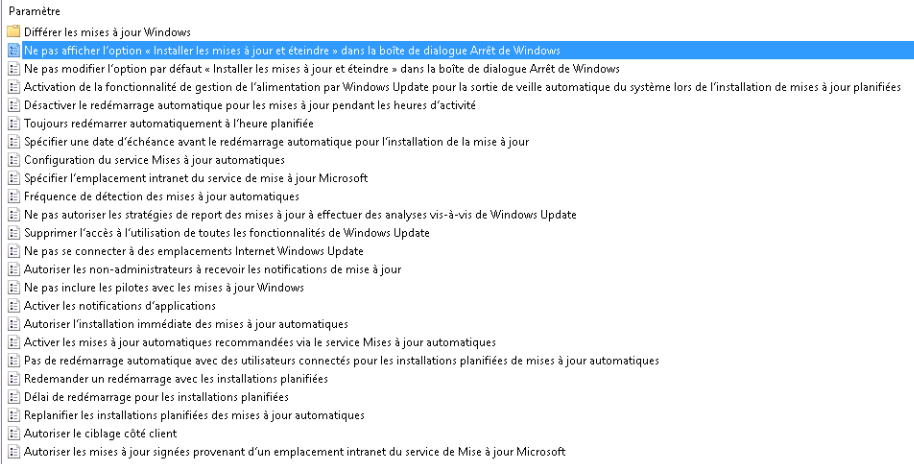
Then we need to use the settings located in Strategies > Administration templates > Windows components > Windows update
Here you can edit every possible settings for the windows clients.
Windows Update GPO Options / Cloudkid
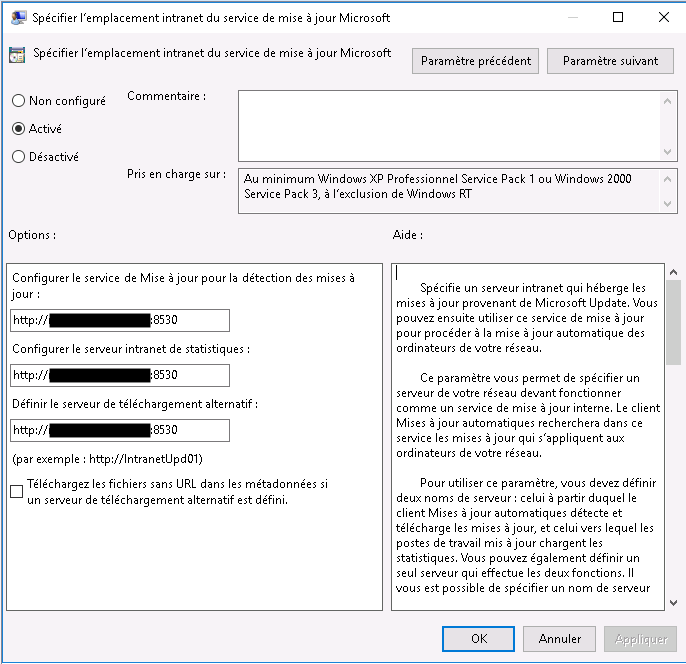
Only one option is mandatory to establish the connection between the service and the client : “Specify the intranet location of the Microsoft update service”.
WSUS
To insure that the rule is applied you can type the following command in the client CMD.
gpupdate /force
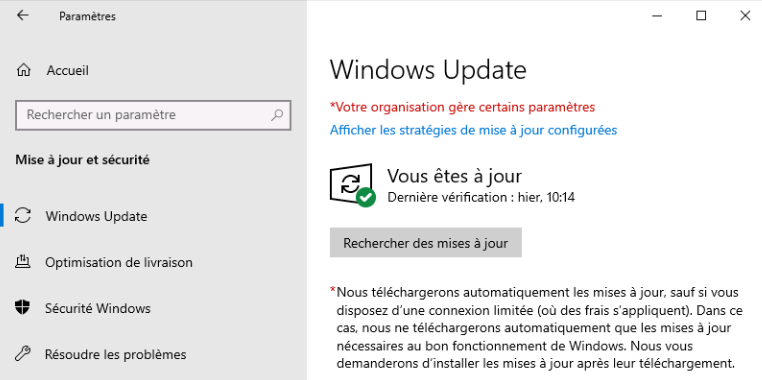
Let’s get back to the Windows update setting tab on our client and check if a red message is present. If it’s the case your GPO as been applied and your windows update settings too !
*Your organization manage some parameters
GPO Applied / Cloudkid
Your updates will now be applied for all of your clients with your selected parameters ! Hope this post was helpful.
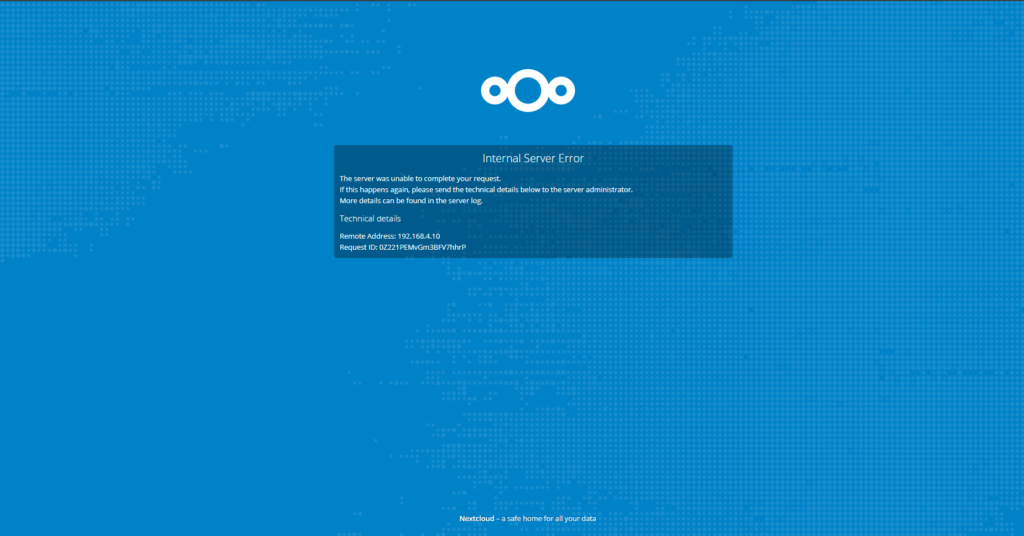
As a classic HomeLab enjoyer I self-host most of the stuff I use daily. But few days ago while maintaining my Nextcloud instance, I updated Nextcloud & MariaDB to catch up on the latest patches. Unfortunately, my docker install was unable to start properly again and I was greeted by the following error :
The Nextcloud error I encountered
So I went to check the Nextcloud logs on my docker container with the following command :
docker logs nextcloud
I immediately realized that was a database error and not a Nextcloud one, the following messages where present :
Doctrine\DBAL\Exception\DriverException: An exception occurred while executing a query: SQLSTATE[HY000]: General error: 4047 InnoDB refuses to write tables with ROW_FORMAT=COMPRESSED or KEY_BLOCK_SIZE. Update failed
From my small knowledge in programming I know one thing, Doctrine is like a link between operations that are queued in the app (Nextcloud in this case) waiting for being written to the database.
InnoDB refuses to write tables with ROW_FORMAT=COMPRESSED
If you want a quick fix you can just rollback to a previous version of mariadb (10.5.11) but if you want to know more about this issue, just stick with me for a bit.
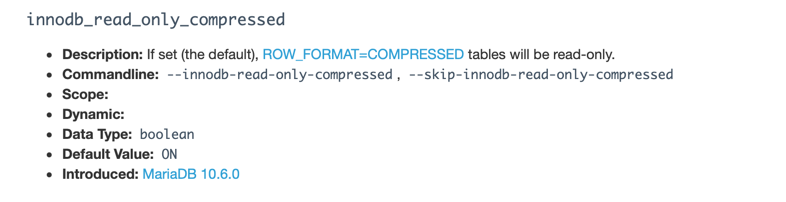
From MariaDB 10.6.0, tables that are of the COMPRESSED row format are read-only by default, the goal here is to deprecate the feature in the future. By setting the innodb_read_only_compressed 3 variable to OFF it make the tables writable.
read_only_compressed
However, this is a workaround rather that a solution. Tables must be migrated. Hopefully they should be migrated automatically by Nextcloud in an incoming update soon. It is wise not to touch the table’s definition in order to not break the (hopefully) incoming Nextcloud migration.
How to fix it ?
Standard Install
Access you MariaDB server
Edit the /etc/my.cnf.d/server.cnf file
Find the [mysqld] section
Add the following statement “innodb_read_only_compressed=OFF”
Restart your SQL service
Docker Install
If you are running your app in docker container you can add the command in your docker-compose script to be executed at every startup :